Real Numbers
Occupancy Rate — 6 Month Trend
Pilot Case Study
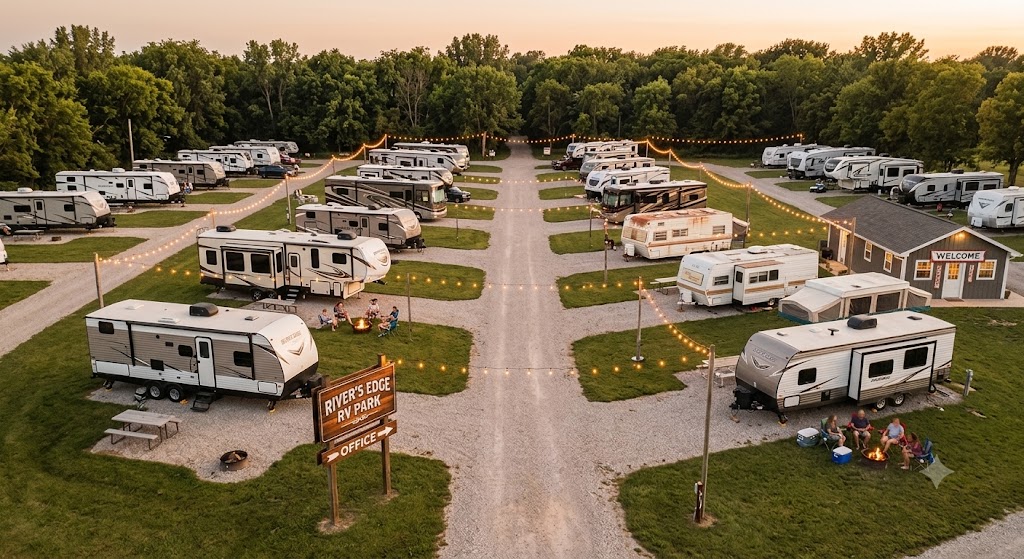
The Setup
A 34-site family park in Anytown, USA with a dated website and almost no online booking presence, sitting well below its market's average occupancy.
"We didn't change anything about the park itself — just how easy we were to find and book. That was the whole gap."
Pilot placeholder — swap in the real Best RV Park story, photos, and verified numbers once available.
The Full Math
*Illustrative example. Actual results depend on market, site count, current occupancy, and local income multiples.